Xcode Breakpoints 101
Knowing how to debug a problem is essential in any project. But there’s way more to it than just stopping at a certain point with a breakpoint. From running custom code, over symbolic breakpoints, to sharing breakpoints via Git, Xcode has something for everyone.
Table of Contents
What’s a Breakpoint Anyway?
The simplest definition would say a breakpoint is a marker in your code to intentionally pause your app if the code is encountered at runtime. If you just click on the gutter to add one in Xcode, that’s true. However, breakpoints are capable of much more.
Looking at breakpoints from a much broader view, they represent a mechanism to gather runtime information to match against their condition. If this condition is met, they execute an action, or if none is configured, pause the running app.
The main advantage of how Xcode (and any IDE/editor I know) handles breakpoints is that you don’t have to predefine them before running your code. They can be added, enabled, disabled, and edited before and after you start your app.
Xcode Breakpoint Options
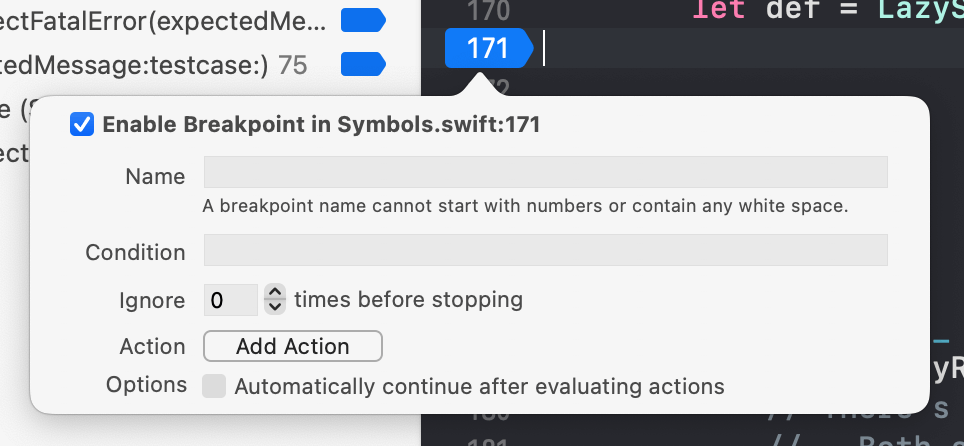
If you click on the gutter, a blue breakpoint marker gets added to it at the line you clicked. Right-clicking this marker reveals the possible options, like editing, disabling, and deleting, but for now, a double-click opens the edit popover:

By default, all options are empty/zero, and your breakpoint just stops if your app encounters the line of code. If you change anything, the marker gets a little white arrow at the tip, making it a “modified” breakpoint.
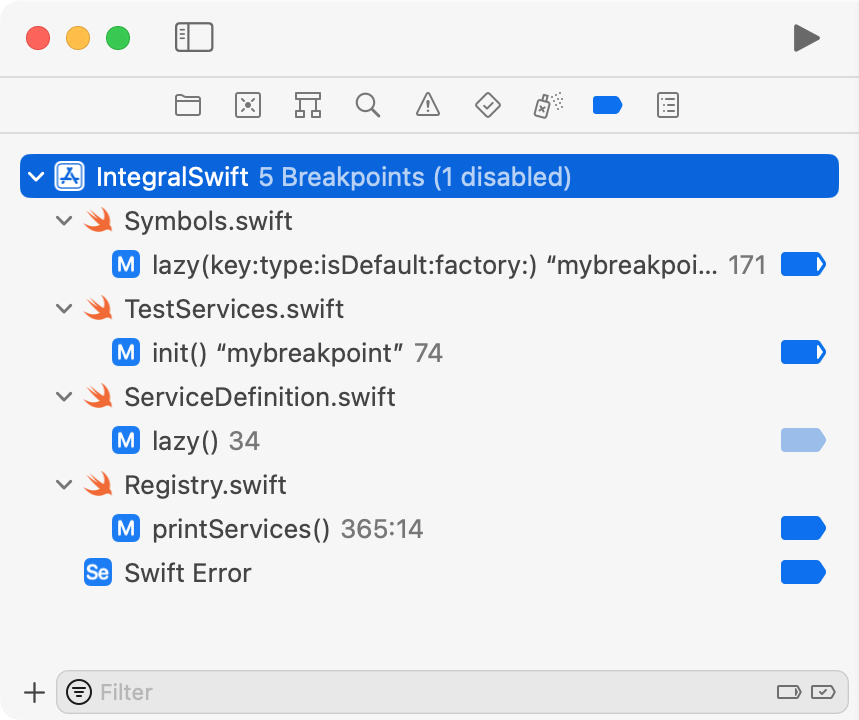
All breakpoints are listed in the Navigator under the breakpoint symbol (⌘8), including their name, the white arrow if modified, and faded out if disabled:

Enough about the basics you most likely already know, it’s time to dive into how to customize your breakpoints!
Customizing Xcode Breakpoints
As you’ve seen before, the edit popover has multiple options for us to play with.

Naming Your Breakpoint
The first option is a name for a breakpoint. There’s not much to it, as the name is only used for display and filter purposes.
For example, if you’re debugging a nasty bug that requires multiple breakpoints to track down, you can group them together by giving them the same name. Then, the Navigator allows you to search and filter for them more easily.
Besides using the name in the Navigator, you can log the name with a custom action.
Custom Conditions
Pausing our app when the code line of a breakpoint is hit is great. But there’s often a certain context to be considered, or you might stop a lot of times before actually hitting the spot you’re looking for.
There are two options available to customize the stopping condition: “condition” and “Ignore X times before stopping”.
The latter, “Ignore X times before stopping”, is self-explanatory and I won’t go into detail. A counter-based condition is quite simple and easy to use, but not as flexible as we might require. That’s where “Condition” comes into play.
The “Condition” field allows us to use an actual expression to define the stopping condition.
Imagine an UITableView with lots of sections, but the bug is related to only the 7th.
We could use the counter, but if we scroll the table, the order of calls might not line up with the actual sections, so a more fine-grained condition is needed:

Writing expression is helped by Xcode providing code completion for the context of the breakpoint.
If needed, we can even mix counters and conditions, as the debugger evaluates both each time the breakpoint is reached.
Execute Actions
The default action of any breakpoint is to pause the running app. However, you can add one or more actions to a breakpoint from the following list:
- Run an AppleScript
- Capture GPU Workload
- Run a Debugger Command
- Log a Message
- Run a Shell Command
- Play a Sound
Each of these options come with additional parameters, which are out of the scope of this article. Many of them are self-explanatory, but if you want to use debugger commands, I recommend checking out this free article on Medium.
One thing actions are great for is replacing “caveman debugging”, which means altering your code by adding print(...) statements all over the place.
Sure, we can always reset the code before committing changes, but it’s easier to not change the code at all, and enable/disable this additional logging with a simple click in the Navigator or gutter of the corresponding file.
The “Log Message” action is great for logging arbitrary messages intermingled with expressions, the breakpoint’s name, and its hit count.
If you only want to print a value, you can use the “Debugger Command” and run something like po indexPath instead.
Don’t forget that you can have multiple actions, so logging a message and then using a debugger command might result in a more reasonable breakpoint. Also, don’t forget to check the option “Automatically continue after evaluation actions” if it fits your needs, like when used for “caveman debugging”.
Even More Breakpoints
Not all code is under our control, so relying solely on code-line-based breakpoints in it isn’t enough. Don’t worry, Xcode got you covered!
The Navigator for breakpoints has a plus icon in the lower left that allows us to add special breakpoints. Also, there’s one type hiding in the right-click menu of expressions.
Column Breakpoints
So far, our breakpoints were based on their code line. But how about code like that?
let validKeys = self.keyTracker.keys.compactMap(entry).filter { !$0.isExpired }The fluent call has multiple expressions, so they need to be debugged independently. Just clicking on the gutter isn’t enough to create an appropriate breakpoint. However, we can right-click on the expression we want to debug and choose “Create Column Breakpoint”:

The breakpoint marker gets added to the expression instead of the gutter, but everything else is the same as any other breakpoint:

One caveat when used with Closures, though.
Due to how the compiler might optimize Closures with anonymous parameters, like $0, Xcode might not be able to resolve a breakpoint.
UseYourLoaf.com filed feedback when they encountered the issue in Xcode 13 (FB9190264) and got the following explanation from an Apple Engineer:
It depends on what the compiler generates for anonymous parameters. Sometimes, the $0 would be as simple as coming from a register and hence the compiler doesn’t need to generate any code for it. In those situations, there will be no breakpoint locations that can be set.
This might be an issue for your debugging needs, but Xcode will highlight such breakpoints and shows an explanation on hover.
Uncaught Errors and Exceptions
When our apps encounter an unhandled Swift Error (e.g., try!) or an Objective-C exception, it crashes, with most likely an unhelpful stacktrace.
To stop before we reach the point of no information, we can add two breakpoint types that aren’t based on actual lines of code via the plus icon in the Navigator:
- Swift Error Breakpoint
- Exception Breakpoint
The Swift one has the “usual” options available.
The Objective-C breakpoint, however, has more C-specific options, including stopping on handled exceptions.
These breakpoints are a great debugging tool if your app crashes unexpectedly and the stacktrace isn’t helping to find the actual issue.
Symbolic Breakpoints
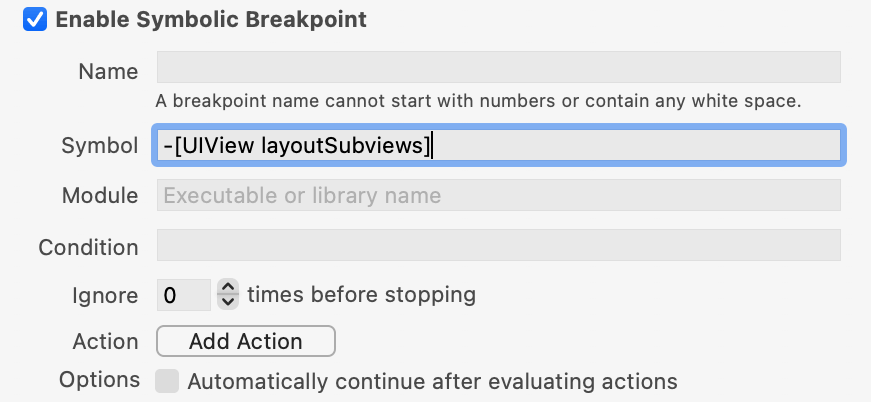
Up to this point, all breakpoints were based on our own code. The Errors/Exceptions ones cast a wider net, but only their single target. A symbolic breakpoint, on the other hand, targets code that doesn’t need to be directly available in your code:

The “Symbol” field accepts, well, a symbol, which syntax might not be familiar, as it leans heavily towards Objective-C:
-(dash) indicates an instance method[object method]is the Objective-C syntax for calling a method on an object
That means that the symbol -[UIView layoutSubviews] triggers on each layoutSubviews call for any UIView.
When you start your application, the Navigator will show you all the methods matching the symbol.
There are also a few symbols for UIKit internals to track down layout issues:
UIViewAlertForUnsatisfiableConstraints triggers on ambiguous layouts and helps you to find undesirable constraint setups.
Luckily the runtime will inform us by printing to the console if such a layout is detected, so we don’t need to have the breakpoint active all the time.
This breakpoint usually stops in your app’s main method, which isn’t very helpful.
The debugger commands po [[UIWindow keyWindow] _autolayoutTrace] and po [[UIWindow keyWindow] recursiveDescription] will show the origin of the underlying by calling these private methods that print out the view hierarchy.
-[UIView(UIConstraintBasedLayout) _viewHierarchyUnpreparedForConstraint:] is another option to identify AutoLayout issues, but it’s hit less often than the previous one.
UICollectionViewFlowLayoutBreakForInvalidSizes helps us to debug sizing issues in UICollectionView flow layouts.
UITableViewAlertForLayoutOutsideViewHierarchy triggers if the visible cells of an UITableView try to layout before they are in the view hierarchy.
CGPostError helps to debug erroneous CoreGraphics calls.
Sadly, there doesn’t seem to be a full list available of these special cases. Sometimes the runtime will output a hint for these, but not always.
Runtime Issues
Runtime issues are a special category watching over things like threading issues. To activate this breakpoint type, you need to add it in the Navigator AND activate “Runtime Sanitization” in your scheme settings in the “Diagnostics” tab.

As the compiler generates additional stuff behind the scenes to enable sanitization, you need to recompile your app with a probably increased build time. However, this breakpoint might reveal some hard-to-track-down issues, so it’s most likely worth it if you have any inexplicable runtime issues.
Constraint Errors
This breakpoint type was initially a macOs only feature, similar to UIViewAlertForUnsatisfiableConstraints.
In later iOS versions, though, it triggers for iOS, too.
To verify where a breakpoint triggers, you can use the debugger command br list, which will show all breakpoints and which code is associated with it.
Test Failures
As the name suggests, this breakpoint stops if a test assertion fails. The debugger stops at the line with the assertion because the tests fail. Like in the preceding example, you get a debug session so that you can put in LLDB commands to find out why the test failed. This helps to fix failing tests directly, instead of running them first, and then debugging manually.
Sharing Breakpoints
With the different kinds of breakpoints Xcode supports, we can build quite intricate setups. Be it helper breakpoints that only run an action, that won’t stop, or helpers for finding layout issues. But if we work with multiple projects, we have to recreate all the nifty helpers each time… or do we?
When you right-click on any breakpoint in the Navigator, there are two interesting context menu items available:
- Share Breakpoint
- Move Breakpoint To
Share Breakpoint via Git
If you set a breakpoint, it’s only available to you in your workspace. But you can choose “Share Breakpoint” to make it available via the Git repository.
In this case, a file called Breakpoints_v2.xcbplist gets created in your project’s/workspace’s xcshareddata/xcdebugger folder.
Just commit this file to share any breakpoints with your team or across machines.
Moving Breakpoints
Another option for sharing breakpoints is to move them between the projects/dependencies in the current workspace, or even across workspaces/projects by elevating a breakpoint to a “User Breakpoint”.
Moving a breakpoint to another project creates a better separation in the Navigator.
Just like with Git-based sharing, a Breakpoints_v2.xcbplist file is created in the corresponding project.
In the case of an SPM dependency, it will live in your derived data, so it might not be permanent.
Another more permanent option is creating a “User Breakpoint”.
These are stored in ~/Library/Developer/Xcode/UserData/xcdebugger/Breakpoints_v2.xcbkptlist and are available in all workspaces and projects.
Non-code-line-dependant breakpoint types like symbolic breakpoints can be useful in any project.
But what about code-specific ones?
Breakpoints are actually more like suggestions, as they need to resolve to be active. We set them in our code/symbols/etc., but behind the scenes, they need to be injected at the right location into the compiled code. That’s why there are rare scenarios, where you can set a breakpoint in the IDE, but it might not be activatable at all. This, however, allows us to share breakpoints between projects that won’t resolve, without creating problems.
One More Thing
Now that we discussed the different kinds of breakpoints available to us in Xocde, here’s a nifty tip on how to use breakpoints to simplify testing your app.
Imagine your working on an app with a login screen, or any screen where you need to type in some information.
Each run it’s the same…
You could of course change the code to set a value for the usernameTextField and passwordtextField, even hide the code behind a compiler directive, but how about using a breakpoint instead?
A “Debugger Command” in a breakpoint can run the following:
expr usernameTextField.text = "ben123"
As breakpoints support multiples actions, let’s add another:
expr passwordTextField.text = "mysupersecretpassword"
Don’t forget to check “Automatically continue after evaluating actions”, so it just happens at runtime without stopping.
Now you can activate the breakpoint for simpler testing, but won’t accidentally check in some code with default values that shouldn’t exist!
Another scenario for this approach is modifying values. Sometimes it’s quite hard to create the correct context for a bug, so you can add a breakpoint to modify a variable just before the possible buggy code to verify the bug exists.
Conclusion
Debugging is an essential task for every developer, so knowing your tools is an absolute must.
Sure, we can rely on print statements littered throughout the code.
But knowing how to utilize the different types of breakpoints is a way better approach.
There’s so much more to breakpoints than “just stopping”, and the knowledge will help you regardless of the IDE your using, as most of them use similar concepts.
The one Xcode-specific thing that’s IMO a game change for your debugging skills is learning more about debugger commands. Even when not used directly in a breakpoint, they will help you immensely to dissect what’s going on.
